Results of operations
Change in disclosure and restatement of prior-year disclosures
Owing to the presentation changes made and the related restatement of the prior-year figures in accordance with Sec. 265 (2) Sentence 3 HGB, some of the figures presented deviate from the figures reported in prior years. Detailed information on this matter is presented in the separate financial statements of HUGO BOSS AG.
Sales development
In fiscal year 2013, sales of HUGO BOSS AG decreased by 2% to EUR 1,067 million (2012: EUR 1,093 million). This development is attributable to a decrease in sales with third parties as well as a reduction in the volume of sales with wholesale partners. This was only partially compensated for by the positive development of sales generated by subsidiaries in the Group's own retail business.
Regional sales performance (in %)
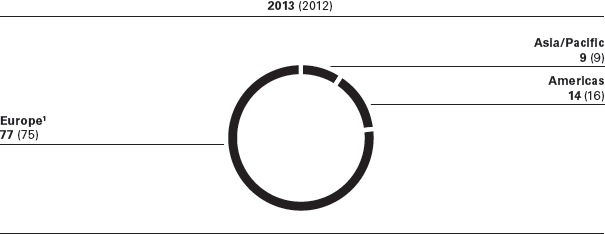
1 Including Middle East and Africa.
In Europe (including the Middle East and Africa), sales with subsidiaries of HUGO BOSS AG decreased by 3% to EUR 387 million in fiscal year 2013 (2012: EUR 400 million). By contrast, sales with third parties increased by 4% to a EUR 436 million in the same period (2012: EUR 420 million). Sales outside Germany and Austria were mainly generated with subsidiaries.
HUGO BOSS AG's sales in the Americas decreased by 17% to EUR 145 million (2012: EUR 174 million). In Asia/Pacific, HUGO BOSS AG reported a 1% increase in sales to EUR 100 million (2012: EUR 99 million).
BOSS brand sales decreased by 3% to EUR 940 million (2012: EUR 974 million). By contrast, the HUGO brand generated an increase in sales of 7% to EUR 127 million in fiscal year 2013 (2012: EUR 120 million).
|
Income Statement HUGO BOSS AG (in EUR million) |
|||||||||||||||||||||
|
|
|
|
|
|
|
|
|
|
|
|
|||||||||||
|
|
|
2013 |
|
In % of sales |
|
2012 |
|
In % of sales |
|
Change in % |
|||||||||||
|
|||||||||||||||||||||
|
Net Sales |
|
1,067.3 |
|
100.0 |
|
1,093.4 |
|
100.0 |
|
(2) |
|||||||||||
|
Cost of sales |
|
(653.9) |
|
(61.3) |
|
(681.8) |
|
(62.4) |
|
4 |
|||||||||||
|
Gross profit |
|
413.4 |
|
38.7 |
|
411.6 |
|
37.6 |
|
0 |
|||||||||||
|
Distribution Costs |
|
(298.9) |
|
(28.0) |
|
(283.8) |
|
(26.0) |
|
(5) |
|||||||||||
|
General administrative expenses |
|
(101.3) |
|
(9.5) |
|
(93.3) |
|
(8.5) |
|
(9) |
|||||||||||
|
Other operating income |
|
131.8 |
|
12.3 |
|
126.3 |
|
11.6 |
|
4 |
|||||||||||
|
Other operating expenses |
|
(59.1) |
|
(5.5) |
|
(61.7) |
|
(5.6) |
|
4 |
|||||||||||
|
Operating profit |
|
85.8 |
|
8.0 |
|
99.1 |
|
9.1 |
|
(13) |
|||||||||||
|
Income from investments in affiliated companies |
|
196.6 |
|
18.4 |
|
250.8 |
|
22.9 |
|
(22) |
|||||||||||
|
Interest result |
|
(10.6) |
|
(1.0) |
|
(13.3) |
|
(1.2) |
|
20 |
|||||||||||
|
Income from ordinary activities |
|
271.8 |
|
25.5 |
|
336.6 |
|
30.8 |
|
(19) |
|||||||||||
|
Taxes on income and other taxes |
|
(61.1) |
|
(5.7) |
|
(48.3) |
|
(4.4) |
|
(27) |
|||||||||||
|
Net Income |
|
210.8 |
|
19.8 |
|
288.2 |
|
26.4 |
|
(27) |
|||||||||||
|
Transfer to (-)/from (+) other revenue reserves |
|
20.1 |
|
1.9 |
|
(72.6) |
|
(6.6) |
|
(128) |
|||||||||||
|
Accumulated income previous year |
|
4.3 |
|
0.4 |
|
4.0 |
|
0.4 |
|
8 |
|||||||||||
|
Unappropriated income |
|
235.1 |
|
22.0 |
|
219.6 |
|
20.1 |
|
7 |
|||||||||||
At EUR 413 million, the gross profit was up slightly on the prior-year level (2012: EUR 412 million). The gross profit margin hence increased from 37.6% in the prior year to 38.7%. Apart from the higher share in sales contributed by the Group's own retail business compared to the prior year, this development reflected both the efficiency improvements in production and procurement activities as well as the positive effects from the improved inventories situation. Exchange rate effects had an adverse effect on gross profit.
Distribution costs increased by 5% to EUR 299 million in the fiscal year (2012: EUR 284 million). This development mainly relates to the expansion of the Group's own retail business. Increased sales in this distribution channel led to increased expenses in connection with rental agreements linked to sales performance.
General administrative expenses increased by 9% to EUR 101 million (2012: EUR 93 million) and mainly comprised personnel expenses, rent for premises, lease expenses, amortization and depreciation as well as various IT costs. The increase relates to the higher amount of amortization charged on enterprise software in connection with the more capital-intensive nature of the business model.
Other operating expenses mainly comprise research and development costs, bad debt allowances and exchange rate effects and decreased by 4% year on year to EUR 59 million (2012: EUR 62 million). The decrease is largely due to the expenses included in the prior year relating to the stock appreciation rights (SAR) program.
In the past fiscal year, other operating income amounted to EUR 132 million (2012: EUR 126 million) and mainly breaks down into cost allocations and services rendered to affiliated companies.
Compared to the prior year, operating profit decreased from EUR 99 million to EUR 86 million, mainly due to increased distribution costs.
At EUR 197 million, income from investments in affiliated companies decreased compared to the prior-year level (2012: EUR 251 million). Income from investments in affiliated companies mainly concerns the net income of HUGO BOSS Trade Mark Management GmbH & Co. KG amounting to EUR 95 million (2012: EUR 97 million), which is transferred to and drawn from the loan account of HUGO BOSS AG as limited partner in accordance with the partnership agreement. Income from profit and loss transfer agreements pertains to income from profit and loss transfer agreements in place with subsidiaries of HUGO BOSS AG. In fiscal year 2013, this amounted to EUR 102 million (2012: EUR 153 million) and resulted from the transfer of profit from HUGO BOSS Internationale Beteiligungs-GmbH, Metzingen. In fiscal year 2013, this company received dividend income from HUGO BOSS Holding Netherlands B.V. In the past fiscal year, expenses from loss absorption totaled EUR 1 million (2012: EUR 0 million) and relate to the loss absorbed by HUGO BOSS Beteiligungsgesellschaft mbH, Metzingen.
The interest result as a net interest expense (other interest and similar income less interest and similar expenses) decreased to EUR 11 million in fiscal year 2013 (2012: EUR 13 million). This change primarily reflects the lower level of borrowing and the repayment of financial liabilities due to HUGO BOSS International B.V.
Income before taxes came to EUR 272 million in fiscal year 2013 (2012: EUR 337 million). The decrease in income before taxes was attributable to the lower operating profit as well as the lower income from profit and loss transfer agreements and investments in affiliated companies.
At 22%, the effective tax rate was well above the prior-year level (2012: 14%). The dividend income contained in profit transfers and income from a foreign joint venture had a positive effect on the effective tax rate. By contrast, expenses from income taxes relating to other periods of EUR 16 million (2012: EUR 1 million) increased the effective tax rate. These mainly stem from the recognition of a provision for risks in connection with the tax field audit for the years 2007 through 2011 including subsequent effects. Without these two effects, the normalized effective tax rate for the fiscal year would have stood at 28% (2012: 28%).
At EUR 211 million, the net income for fiscal year 2013 was thus down on the prior-year level (2012: EUR 288 million).